 Hi Boox Popular Magazine 2024
Mapping can be done in a myriad of ways, but one of the most popular is Geographic Information Systems (GIS). GIS software is used to create accurate, up-to-date maps of physical spaces. This includes everything from mapping roads and buildings to tracking pests and vegetation. It can be used for a variety of purposes, but one particularly important application is mapping manufacturing facilities.
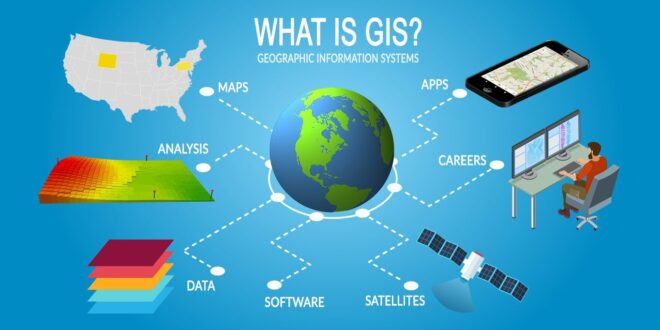
What is GIS?
GIS (Geographic Information Systems) is a computer-based system for managing and displaying data related to location. It can be used for mapping and other spatial tasks, such as land use planning, disaster response, resource management, and environmental monitoring.
One of the most important features of GIS is its ability to integrate different types of data. This means that it can work with maps, databases, photos, and other spatial information. This integration makes GIS superb for creating detailed maps that can show all kinds of information about an area.
There are a number of different ways that GIS can be used for mapping. One way is to use it to create charts and graphs that display data in a more visual manner. This is great for showing changes over time or tracking trends.
Another popular way to use GIS is to create 3D maps. This type of map allows users to see the layout of an area in detail and understand how things are connected together. It can also be used for navigation purposes, permitting users to see what areas they need to avoid in advance during emergency situations.
Overall, GIS is an extremely versatile tool that has many uses in mapping and spatial analysis. It allows users to generate detailed reports that are easy to read and understand.
How does it work?
GIS relies on data to function. This data can come from a variety of sources such as environmental surveys, land ownership records, or even social media posts. Once collected, the data must be organized and cleaned before it can be used in GIS applications. After data is organized, it must be geocoded in order to assign coordinates to each point on the map. Geocoding is a process of assigning specific coordinates to locations on earth using latitude/longitude values.
Next comes map projections. A projection defines how a map will look when displayed on a flat surface such as a computer screen or map paper. There are many popular projections available, but the most common ones are the Mercator projection and Albers projection. Mercator projection distorts distances across wide areas while Albers projection preserves distances between points but distorts angles closer to the viewer. Both projections are commonly used in commercial mapping applications because they produce accurate maps that look good on a wide range of devices.
After projections are selected, the map must be filled in with data. This data can come from a variety of sources, but common data sources include roads, buildings, waterways, and land use boundaries. Filling in the map requires knowledge of map symbology and symbol placement. Symbology is the use of standardized symbols to represent features on a map. For example, one common symbol used to represent roads is a white line drawn on a blue background. Symbol placement is the placement of symbols on a map. For roads, for example, an arrow may be used to indicate the direction of the road.
Finally, the map must be rendered using mapping software. Rendering involves creating a digital representation of the map that can be viewed on a computer or device. Common rendering software includes Google Maps and Microsoft Bing Maps. By using these tools, users can easily view maps of their local area or explore maps from all over the world. When in doubt, using a company that provides mapping services like GIS Service Dubai is a great way to achieve your goal.
How can GIS be used for mapping?
One of the most common uses for GIS is mapping land and property boundaries. This is often done to determine the ownership of land or to identify changes in ownership. GIS can also be used to measure distances and volumes within an area.
Municipal data can also be mapped using GIS. This information can be used to compile statistics about an area, map services available in an area, and track crime trends. Maps of urban areas can help planners understand how people use the space around them and make better decisions about how to develop cities.
What Can be Mapped with GIS?
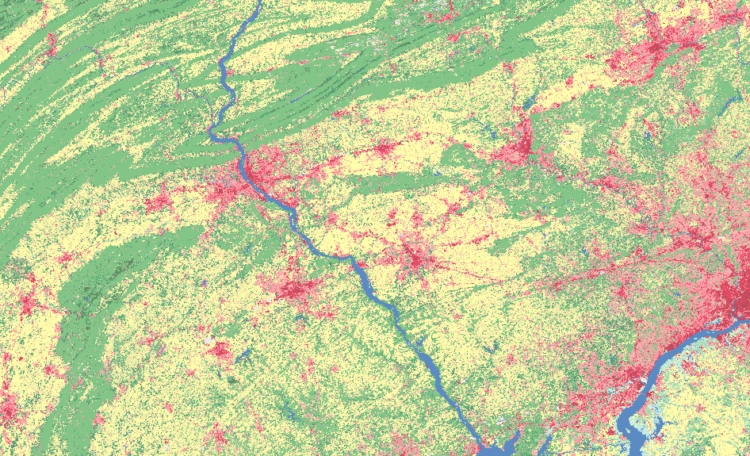
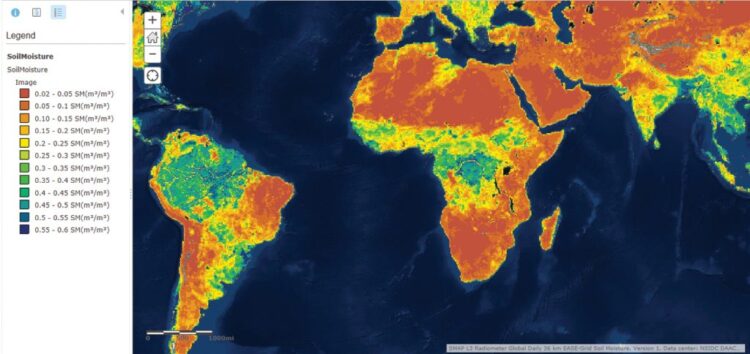
One of the most important features of Geographic Information System Mapping is its ability to bundle data from different sources into a single map. This makes it ideal for use in situations where different sources have conflicting information or where different layers of data need to be displayed on the same map. For example, aerial photography often captures valuable details about land use that ground-based surveys may miss. By incorporating aerial imagery into GIS maps, planners are able to make better decisions about how best to use resources and develop new communities.
Another advantage of using GIS is its ability to visualize complex data sets. By displaying data in a geographic context, users can easily see patterns and relationships that would otherwise be difficult to discern. This feature is particularly useful in cases where large amounts of data must be processed quickly in order to make informed decisions. For example, zoning laws are implemented based on analysis of spatial data compiled from aerial photography and other sources. By displaying zoning violations on a map, officials are able to more easily identify areas that may need extra attention when developing new regulations.
Ultimately, GIS is an invaluable tool for anyone looking to improve their understanding of the world around them. By combining traditional mapping methods with the powerful capabilities of GIS, users are able to create maps that are both accurate and informative.
What tools are used for GIS mapping?
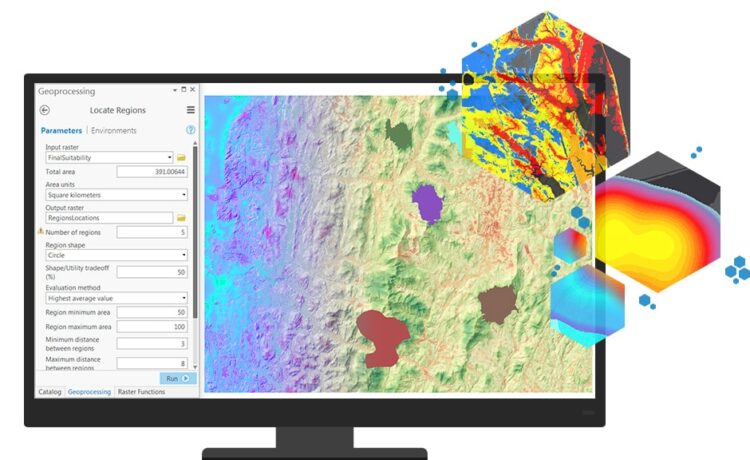
Mapping tools are divided into these categories: desktop, web, server, and specialized. Desktop mapping tools include mapping applications that are installed on a desktop computer. Web mapping tools are accessed through a web browser and allow users to create view, and edit maps. Server-based mapping tools are used by organizations that have their own server infrastructure to store and manage maps. Specialized mapping tools can be used for specific purposes such as land surveying or hydrology.
Cartography software is used to create custom maps using vector data (geographic information). Common cartography software includes Adobe Illustrator and Microsoft Excel. Vector illustrations can be created in any format desired, including PDF, SVG, TIFF, JPG, and PNG files. These files can then be exported and imported into most GIS programs for use in map creation or editing.
Surveying equipment is used to collect data about land properties or features. This data can then be input into GIS databases to produce detailed maps of the area being mapped. Common surveying instruments include lasers (range finders), GPS receivers with position updates every few seconds, digital compasses with 360-degree readings capability, and chainsaws fitted with encoders capable of recording distances traveled.
Conclusion
Mapping is an important part of any business, whether you’re a small business trying to keep track of where your client base is geographically situated or a large corporation looking to expand its market share. GIS can be used for many different purposes in mapping, such as measuring the size and density of your customer base, understanding how traffic flows through your city or town, and even locating new areas for investment. So, if you’re looking to take your mapping skills up a notch, check out some of the resources available online.