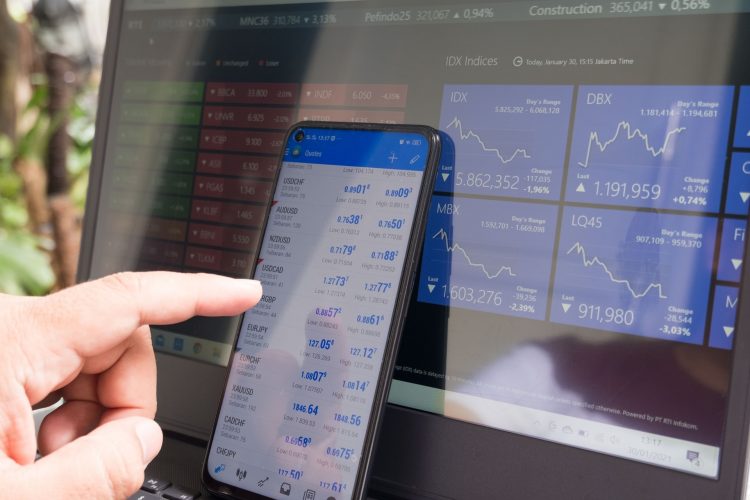
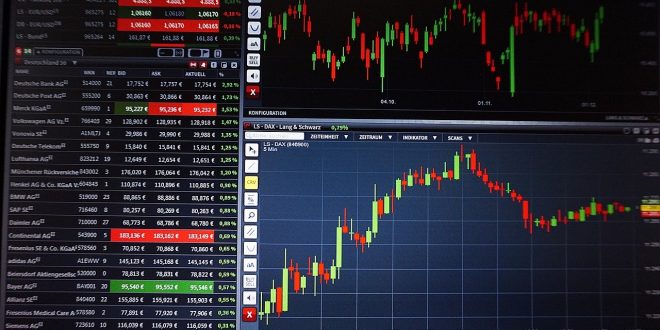
The stock market is one of those very famous things about the world that everyone has heard of but nearly, not enough people actually know a lot about it. Trading stocks is a highly skilled and treacherous career path not everyone is cut out for, but those who are can become very successful and make their lives so much better. The most popular stock markets in the world include the New York Stock Exchange, the Shanghai Stock Exchange, Hong Kong Exchanges, Euronext, and NASDAQ. While there are many more throughout the world, these are the most prominent places where the most amount of business is done.
An Overview

The reason why trading stocks is so difficult is the fact that it is an unpredictable business in which you can become rich or lose everything seemingly overnight. However, it is this volatility that is actually the most profitable chance for the brokers to make money. To maximize their chances and do as well as possible, there exist certain patterns of trading. They have to do with the right amount of trading during the right times, as it greatly matters when you do your trading.
Although the volatility of the stock market is what makes it profitable for day traders, the day tends to follow a certain pattern, which provides a guideline of the times when it is best to trade. It is important to know when prices tend to trend up or down and when they tend to reverse quickly. These time-based patterns throughout the day have been repeating over and over again over the many years of the stock market’s existence. They tell us when trends typically reverse or have a significant pullback and according to them, the brokers can make their decisions. These time of day patterns also inform when volatility tends to rise and subside.
Patterns Explained

It is important to note that these patterns do not repeat every day, but since they occur often, they can be an important tool in your overall trading strategy. One of the most noticeable patterns is that volatility tends to shrink during the New York lunch hour, relative to other times of the day. There may be some days that have high volume during lunch hour, but generally, volatility drops off and prices may even flatten out instead of having a strong trend in either direction. The lunch hour actually extends from about 11:30 a.m. to 1:30 p.m.
By noticing this drop in volume and volatility, you could save yourself some time and losses by avoiding trading during this time. Again, this is not an absolute, but if you are trading throughout the lunch hour, it might be worth taking a look at your hour-by-hour statistics to see if there are any adjustments that you could make. It makes sense for everything to kind of slow down or even stops during this time because the brokers and other employees are on their biggest daily break.
There are other intraday patterns to look for throughout the day that might help inform your trading behaviors. These are the times of day when there are generally reversals or significant pullbacks. Based on Eastern time with a trading day occurring between 9:30 a.m. and 4:00 p.m. and index movements, which is basically an average of many stocks, you may want to do an analysis of your individual stocks as there might be slight differences, then use those patterns to your advantage.
The first hour of the day is usually the most volatile, which again, makes sense since it is when everyone gets to work and wants to make the best of their workday. The second most volatile time of day is usually the last hour of the day. It is the wish of many brokers to save their daily victories and good deals by taking it slowly towards the end so there is more room for those more aggressive. In addition, those who have had a rough day with their stock trading often ant to at least even things out by the end of the day and prepare for one final push before the day ends.
Another significant time pattern of the day is just before 11:30 a.m. when the London market closes, creating a new high or low since European traders are getting out of their positions. As previously mentioned, lunchtime hours between 11:30 a.m. and 1:30 p.m. are typically quiet since it is the New York lunch hour. Again, this is not always the case, so if you see a lot of movement during the lunch hour, then treat it as you would any other time of day.
Between 1:30 p.m. and 2:00 p.m. is when the market tends to reassert itself, then between 2:00 p.m. and 2:45 p.m., you should be wary since reversals during this time are typically very quick as it is nearing the end of the day and institutions are shuffling their positions as they approach the close. Second, only to the first hour of the day, the last hour of the day is the most volatile, which can mean big opportunity and/or big risk, so keep a mindful eye.
Conclusion and Takeaways

As you can see just from the differences in patterns, stock trading and the whole industry are very complicated and finely tuned. Although it makes perfect sense why the patterns like this exist, it is still difficult to use them to your advantage in a good way. There is a general understanding and respect that exists, but many brokers use the downtime to make big money moves as their competitors are on their break. It pays to evaluate your best options and strategize in a different way from the rest.
There are many different considerations when day trading and financial education are crucial for a successful future. One option worth looking into is stock market investments. If you want to learn more about all of this, be sure to check out thedaytraderchatroom.com as it is a great site that can help with stock market education and help you learn how to get over the PDT rule.
 Hi Boox Popular Magazine 2024


